
I Built a Computer Ratings Model for Nebraska High School Sports. Here’s What AI Changed.
How building a ratings model for 500+ Nebraska teams taught me that AI content is a data pipeline problem — and what I still haven't solved.

There are over 500 high school basketball teams in Nebraska when you count boys and girls programs.
Some rating systems exist, but often they do not cover all teams or the weightings seem off. The current point system is blunt: you get the same credit regardless of who you beat. Strength of opponent doesn’t enter into it.
The various other polls are well-regarded, but they’re still human judgment at the end of the day.
What was missing was something comprehensive, covering every class and every program, with a model nuanced enough to reward beating a good team.
The Model Itself
The ratings engine processes tens of thousands of games in a season — more when you factor in the historical data I’ve added over time. It accounts for margin of victory, strength of schedule, home/away splits, and recency. It runs continuously through the season, updating as new results come in.
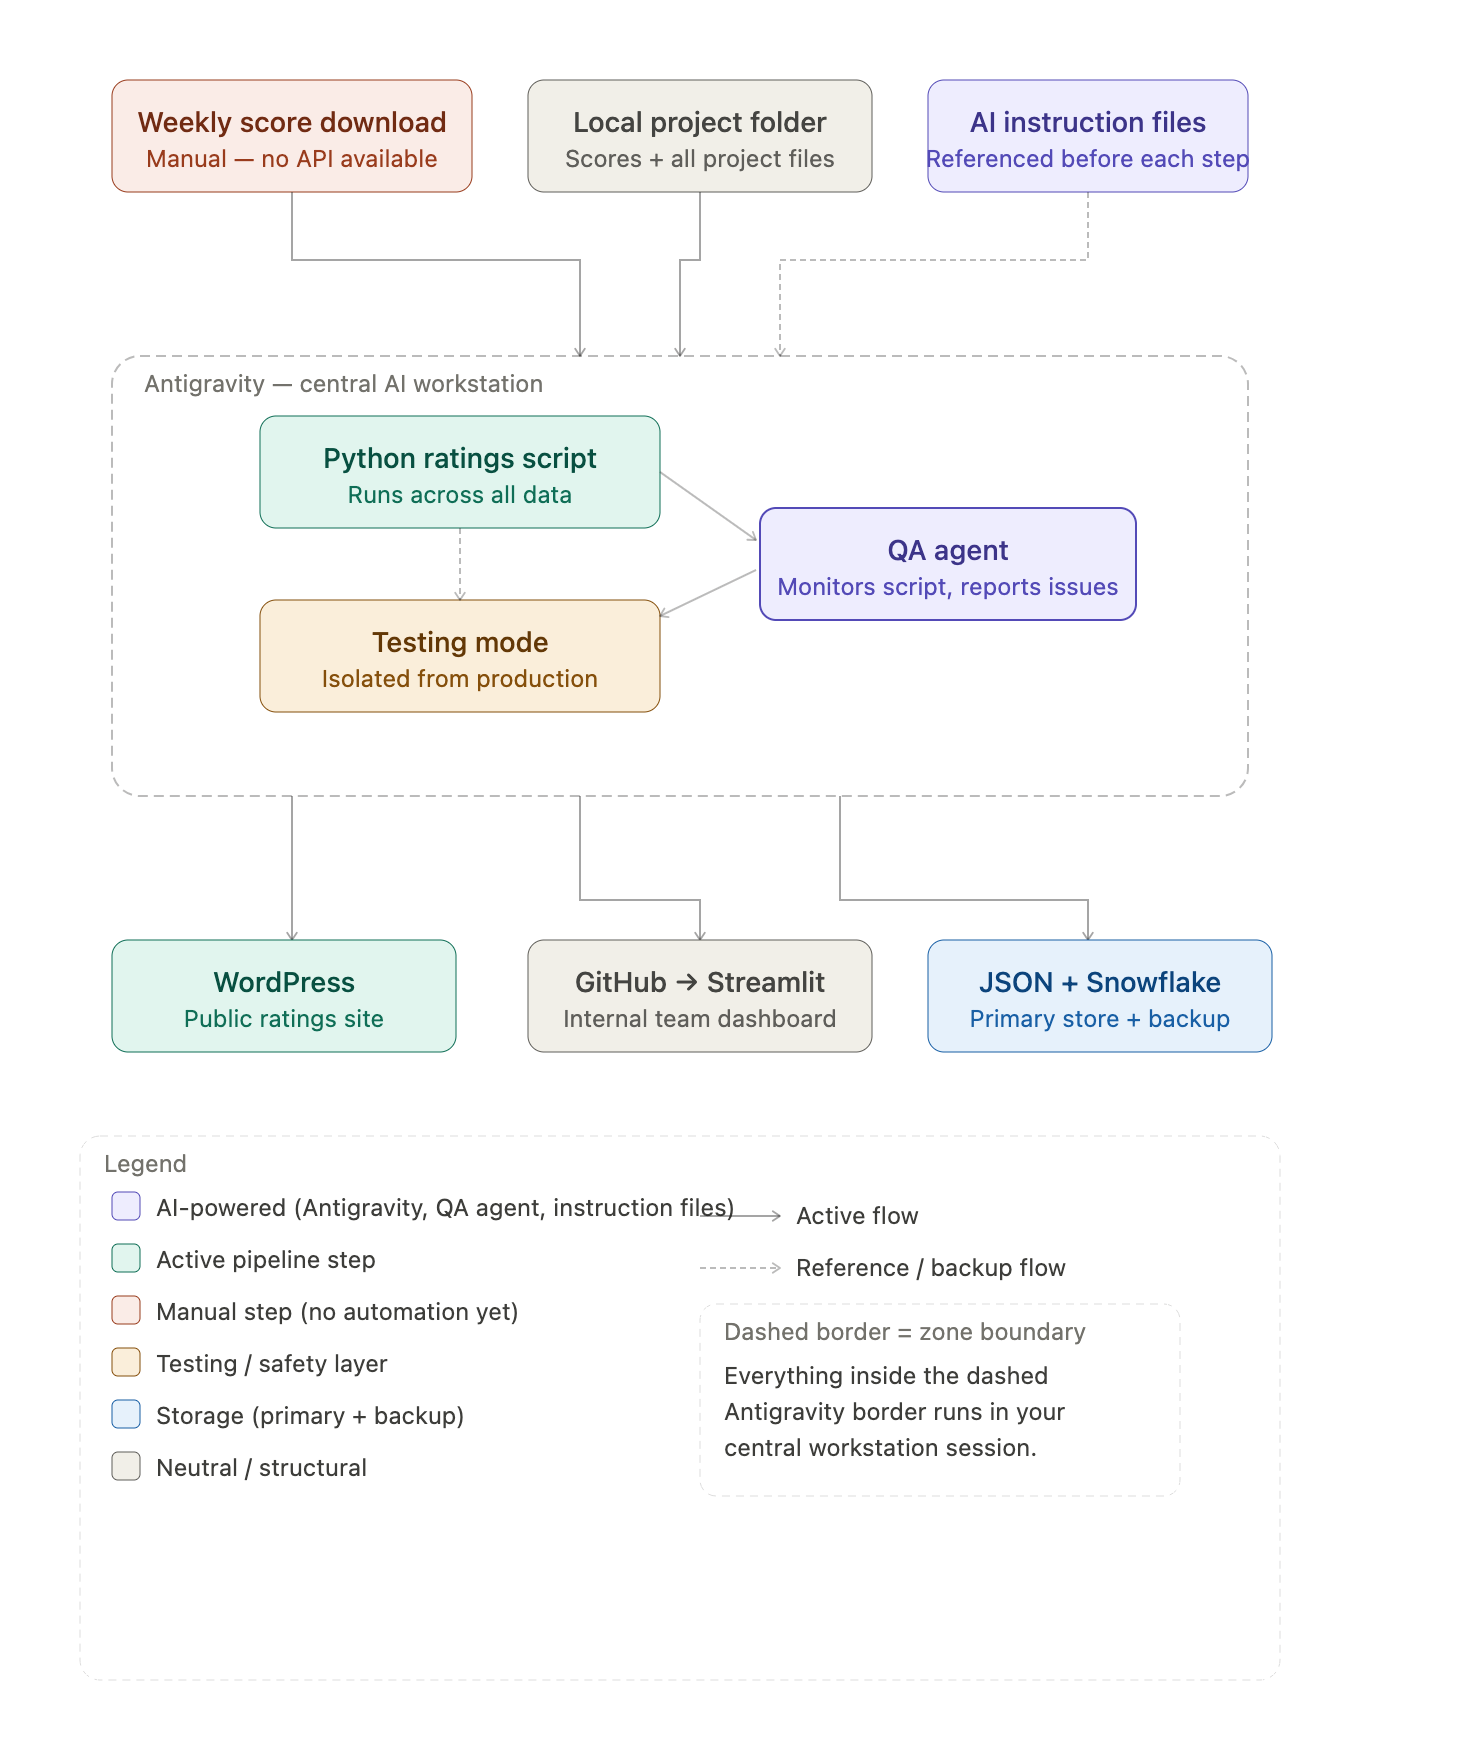
The data infrastructure is more involved than it might sound. Ratings live in flat JSON files, backed up to Snowflake. Updated standings get pushed to WordPress for the public-facing site. Our sports team accesses a separate internal dashboard built on Streamlit, which pulls directly from GitHub whenever changes are pushed. It’s all connected, and it mostly runs itself, except for new scores I download / upload weekly.
What We Actually Publish
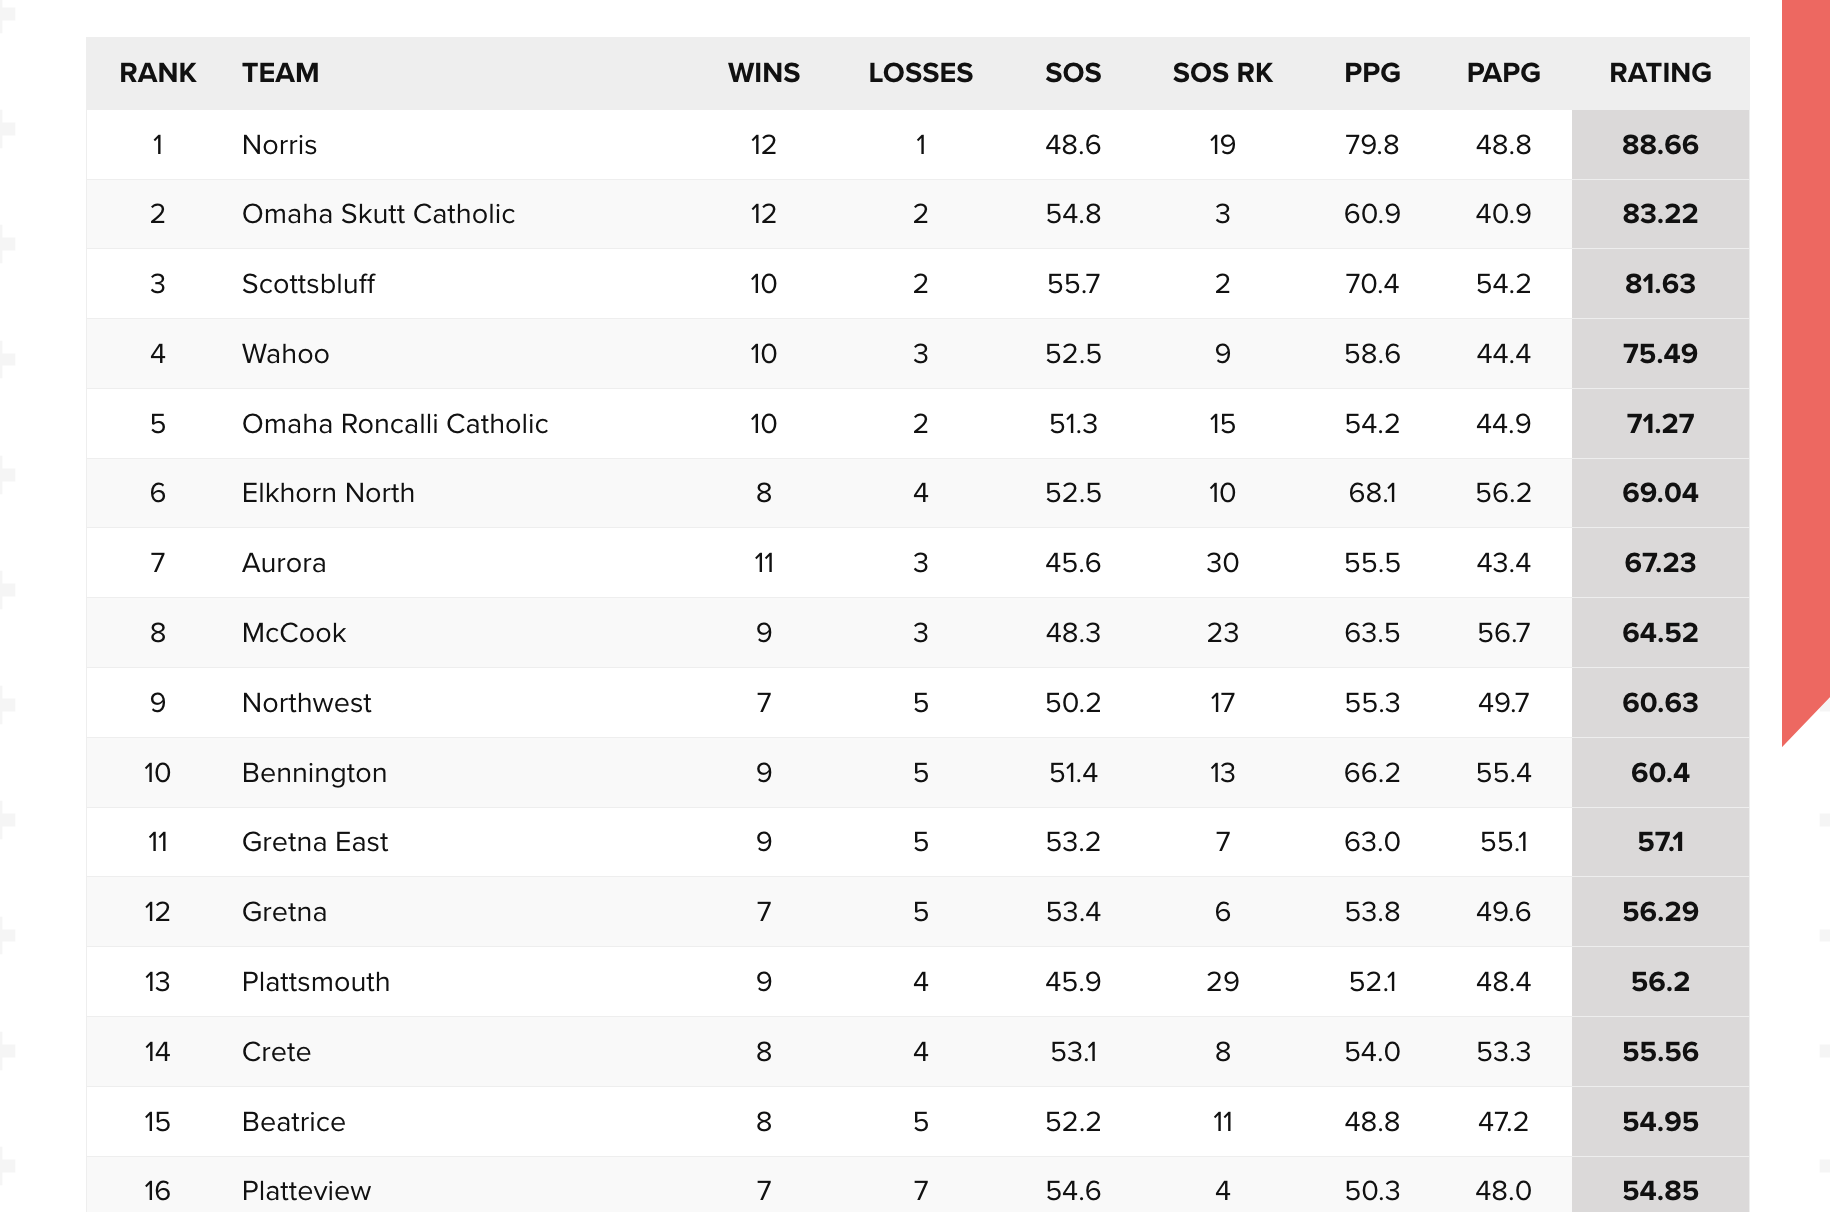
Every week we post updated ratings — a table with current rankings and team stats for every program in the state. That’s the baseline.
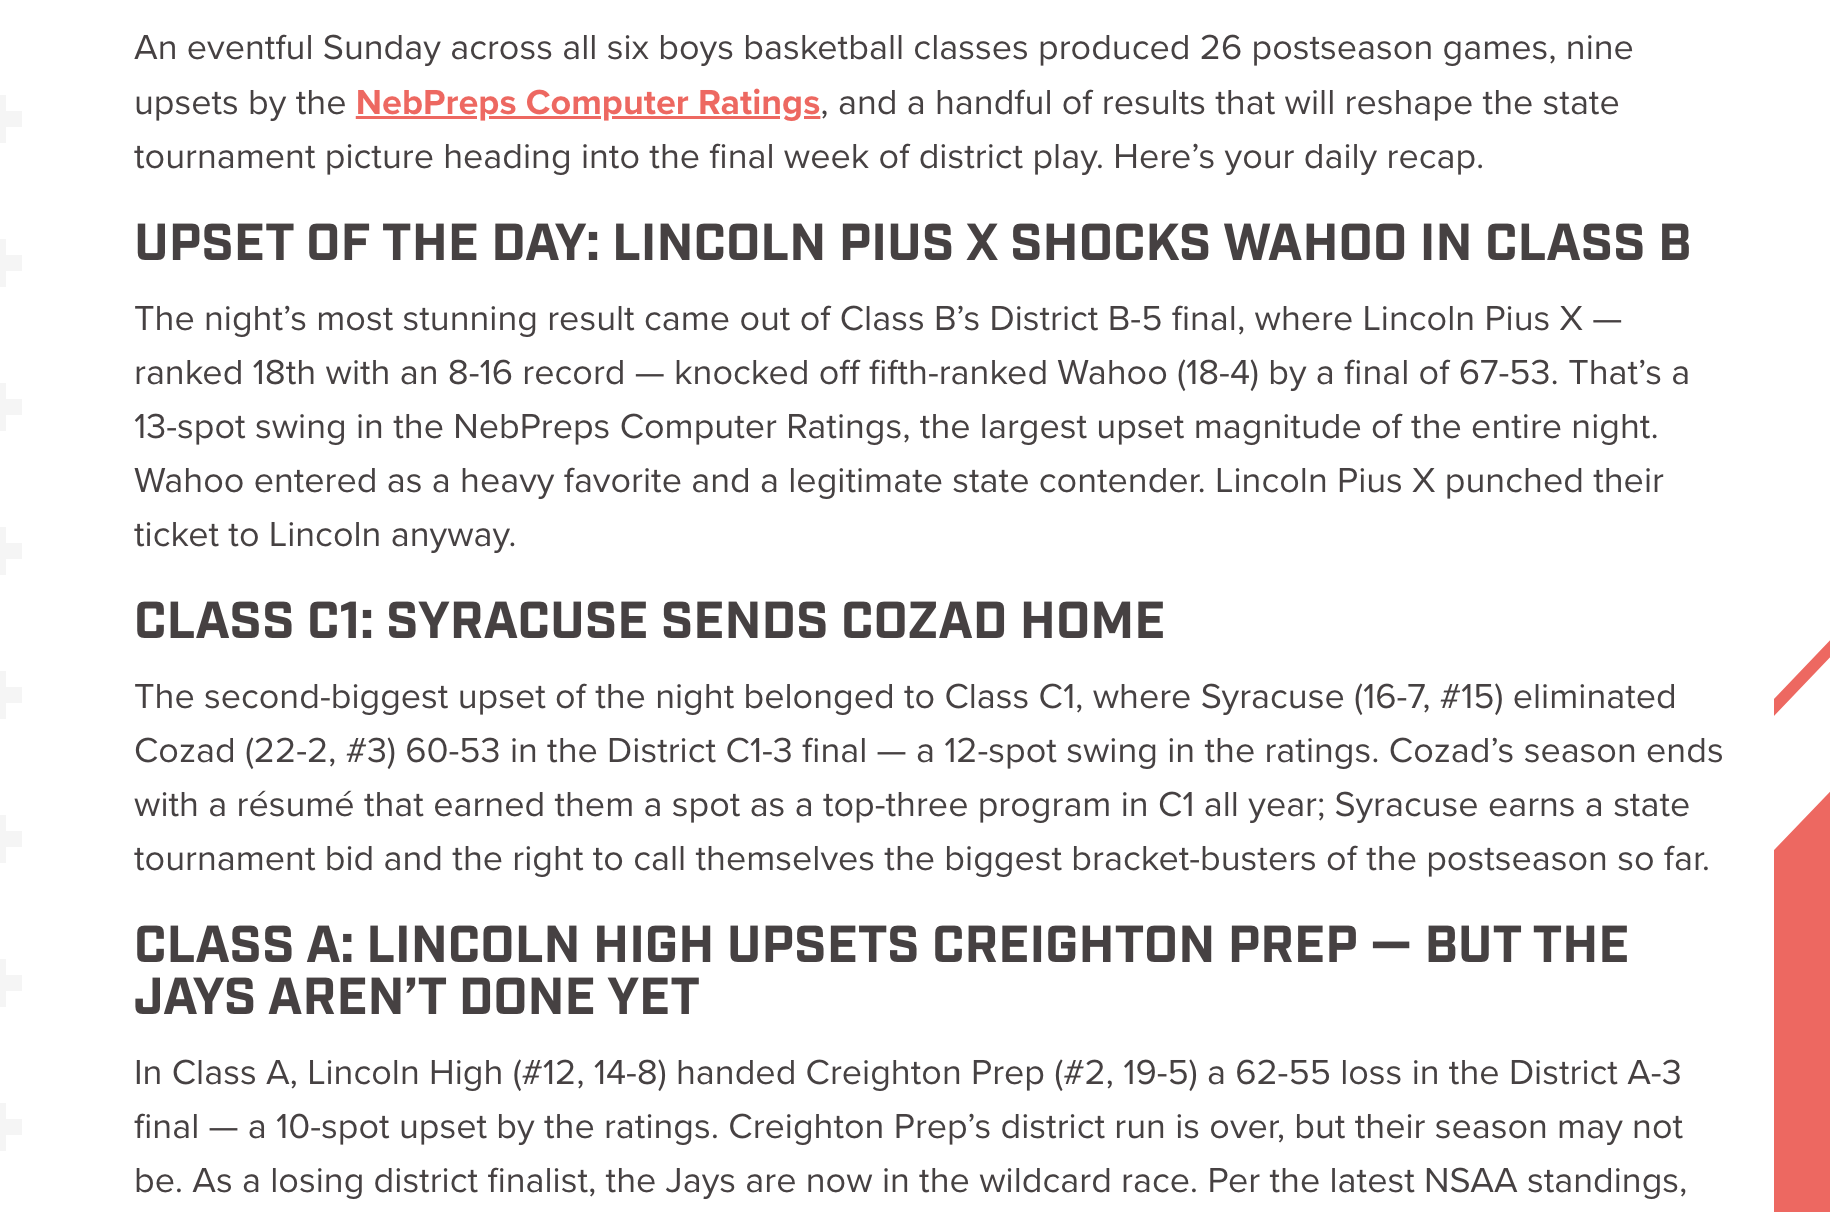
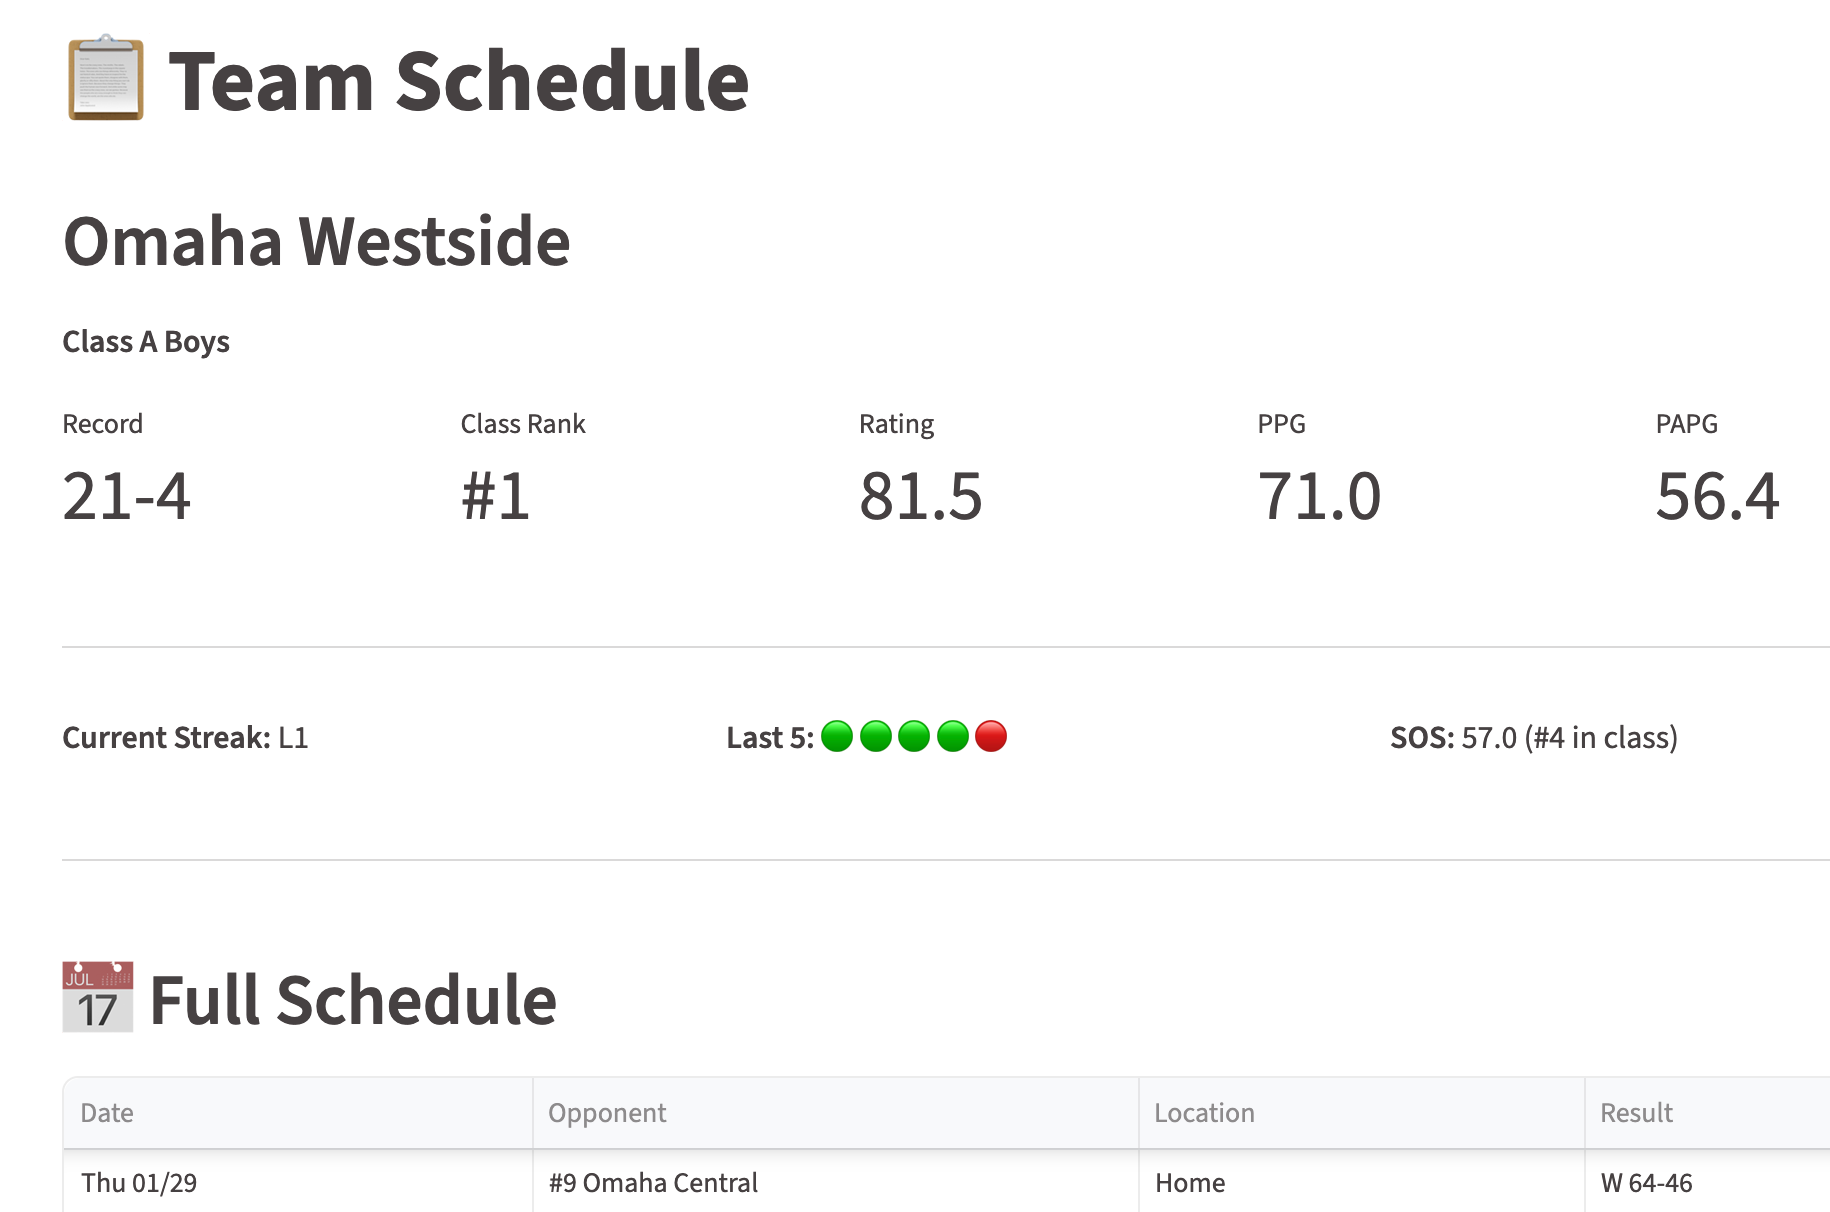
But the part I’m most curious about was one we experimented with during Districts. I built automated summary posts that went well beyond a rankings table — detailed recaps of what happened the day or week before, and sometimes previews of the upcoming games worth watching. The data made those posts genuinely useful: ratings context, schedule strength, historical matchup information. Readers could see not just who was ranked where, but why a particular game mattered.
I stopped the automation at State. Our journalists cover that and they do a terrific job — it’s all in one place in Lincoln, which makes it manageable in a way that the full regular season isn’t. The automation exists to provide coverage that otherwise couldn’t due to scale. Where great human coverage already exists, it should stay human.
The result isn’t Pulitzer-worthy prose. But it’s real, accurate, contextual coverage for a game between two small-town teams in Class D that would otherwise get few, if any, words written about it. And we leave the real story-telling to our wonderfully talented journalists.
What I’ve Actually Learned
Structured data is the real unlock. The quality of AI-generated sports content is almost entirely determined by the quality of the data behind it. Generic prompts produce generic output. When you give the model actual ratings, actual opponent context, actual historical results — the output gets genuinely useful fast. The Districts posts worked because the data was rich, not because the prompts were clever.
The pipeline matters more than the model. The more important question was never which LLM to use — it was how to get the right context into the right place at the right time. Building the data infrastructure that makes that possible is most of the work. The model selection is almost an afterthought once the pipeline is solid.
Niche is an advantage. Nebraska high school sports is a small domain. That means I can build something extremely specific — context that a general-purpose AI tool would never have — and that specificity is what makes the outputs valuable. The more I lean into the niche, the better everything gets.
Know when to step back. Automation should fill gaps, not replace things that are already working. Stopping at State wasn’t a limitation — it was the right call.
What I Still Haven’t Figured Out
Quality control at scale. The automation works. But I don’t have a great system for knowing when an individual output is off — a weird inference, a thin preview that doesn’t have enough to say — without reading every one. I’m still relying too much on spot-checking.
Getting data in is still a manual step. The source data is essentially uncrawlable — the volume is too high, the structure makes automated scraping brittle, and there's no API. I've looked. There's no clean way to get it at scale even if you're willing to pay for it. The current process isn't terrible: I download 12 files each week, drop them in a folder, and the system takes it from there. But it's a manual dependency in what is otherwise a fairly automated pipeline, and it's the part I'd most like to solve long term — even though I'm not sure there's a good solution yet.
When to just not publish. The automated District posts worked because there was always something worth saying — upsets to recap, marquee matchups to preview, outliers worth calling out. But not every stretch of the season is like that. Some weeks are quiet. The unsolved problem is building logic that recognizes when there isn't enough genuinely interesting material to justify a post — and skips it — rather than publishing something thin just to maintain cadence. Right now that's still a judgment call for the journalists, although they do have an internal command center where they can sift through all kinds of interesting data to support their writing.
Where It’s Going
The ratings model is mature. The Districts automation proved the concept. The longer-term vision is consistent, data-backed coverage for more Nebraska sports.
AI isn’t making that possible because it’s magic. It’s making it possible because it finally closes the gap between having the data and doing something useful with it.
That gap was always the problem. Turns out it was an infrastructure problem all along.
This newsletter is about being an AI engineer generalist — building real things across different domains, figuring out what works, and being honest about what doesn’t. NEBPreps Computer Ratings is one of many projects. More on the others soon.